Grafana
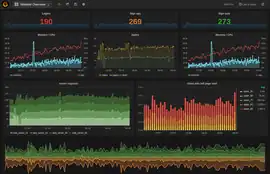
Grafana(グラファナ)は、分析およびインタラクティブな視覚化を可能にする、マルチプラットフォームで動作するオープンソースのWebアプリケーションである。サポートされているデータソースに接続することで、Webブラウザ上でチャート、グラフ、アラートの機能を提供する。追加機能を備えたライセンスを必要とするGrafana Enterpriseバージョンは、セルフホストインストールまたはGrafana Labsクラウドサービスのアカウントで利用できる[4]。Grafanaは、プラグインシステムを介して機能を拡張することができる。エンドユーザーは、インタラクティブなクエリビルダーを使用して複雑な監視ダッシュボードを作成できる[5]。Grafanaはフロントエンドとバックエンドに分かれており、それぞれTypeScriptとGoで書かれている[6]。
 | |
| 開発元 | Grafana Labs |
|---|---|
| 初版 | 2014年1月19日[1] |
| 最新版 |
7.5.3
/ 2021年4月7日[2] |
| リポジトリ |
github |
| プログラミング 言語 | |
| 対応OS | Cross-platform |
| 種別 | アプリケーションソフトウェア |
| ライセンス | GNU AGPL[3] |
| 公式サイト | grafana.com |
視覚化ツールとして、Grafanaはモニタリングのスタックとして人気のあるコンポーネントである[7]。そのため、InfluxDB、Prometheus[8][9]、Graphite[10]などの時系列データベース、ensu[11]、Icinga、Checkmk[12]、Zabbix、Netdata、PRTGなどの監視プラットフォーム、ElasticsearchやSplunkなどのSIEM、その他のデータソースと組み合わせて使用されることがよくある。
歴史
Grafanaは、Orbitzでのプロジェクトの派生物として、Torkel Ödegaardによって2014年に最初にリリースされた。はじめはInfluxDB、OpenTSDB、Prometheusなどの時系列データベースのみを対象としていたが、MySQL、PostgreSQL、Microsoft SQL Serveなどのリレーショナルデータベースもサポートするように進化した。2019年、GrafanaLabsはシリーズAファウンディングで2400万ドルを獲得した[13]。
Grafanaのユーザインタフェースは、もともとはバージョン3のKibanaに基づいていた[14]。
カンファレンスGrafanaCon2020は、2020年5月13〜14日にアムステルダムで開催される予定だったが、COVID-19のパンデミックにより、2日間のオンラインライブストリーミングイベントに変更された[15][16]。
ライセンス
2021年4月20日時点で、GrafanaはAGPLv3ライセンスでライセンスされるようになった[18]。Grafanaへのコントリビューターは、GrafanaLabsに将来Grafanaを再ライセンスする権利を与えるContributor License Agreementに署名する必要がある。CLAは、Apache Software FoundationのIndividual Contributor License Agreementに基づいている[19]。
それ以前は、GrafanaはALv2ライセンスでライセンスされており、Harmony Contributor Agreementに基づくCLAを使用していた[20]。
出典
- “Grafana v1.0.0”. GitHub (2014年1月19日). 2021年4月9日閲覧。
- “7.5.3 (2021-04-07)”. GitHub (2021年4月7日). 2021年4月9日閲覧。
- “LICENSE” (2021年4月20日). 2021年4月20日閲覧。
- “Grafana Enterprise Stack”. Grafana Labs. 2021年3月19日閲覧。
- Perrin. “Monitoring Linux performance with Grafana”. OpenSource.com. 2018年8月14日閲覧。
- Synopsys. “The grafana Open Source Project on Open Hub: Languages Page”. Open Hub. 2021年3月19日閲覧。
- Anadiotis. “DevOps and observability in the 2020s” (英語). ZDNet. 2020年2月4日閲覧。
- Jones (2019年1月25日). “Open Source Monitoring Stack: Prometheus and Grafana” (英語). Bizety. 2019年5月8日閲覧。
- DeLosSantos (2018年). “Netdata, Prometheus, Grafana stack” (英語). Netdata Documentation. 2019年5月8日閲覧。
- Assaraf. “Grafana Vs Graphite” (英語). Coralogix. 2021年5月16日閲覧。
- Kumar (2017年1月21日). “Step By Step: Install and Configure Sensu + Grafana” (英語). Powerupcloud Tech Blog. 2019年5月8日閲覧。
- “Exporting Check_MK Performance Data to Grafana” (英語). TruePath Technologies (2018年). 2020年9月24日閲覧。
- Anadiotis. “Is open source the way to go for observability? Grafana Labs scores $24M Series A funding to try to prove this” (英語). ZDNet. 2020年2月4日閲覧。
- Ödegaard (2019年9月3日). “The (Mostly) Complete History of Grafana UX”. grafana.com. 2020年10月6日閲覧。
- “GrafanaCon 2020”. 2020年5月4日閲覧。
- Dam (2019年12月12日). “Register Now! GrafanaCon 2020 Is Coming to Amsterdam May 13-14”. grafana.com. 2021年5月16日閲覧。
- “grafana.wikimedia.org”. Wikitech. 2021年4月9日閲覧。
- Dutt (2021年4月20日). “Grafana, Loki, and Tempo will be relicensed to AGPLv3”. grafana.com. 2021年4月21日閲覧。
- “Grafana Labs Contributor License Agreement”. grafana.com (2021年4月20日). 2021年4月21日閲覧。
- “Grafana Labs Contributor License Agreement”. 2021年1月22日閲覧。